From Armstrong
"close tomorrow below 18247.79 means move lower into early October
Close below 18138 means close the year below 17823"
It looks like we won't hit either of these sell signals.
On Gold
"A closing below 1347 will imply weakness into year-end."
This one is met. Sorry gold bugs! I will probably be looking at paper shorting when Evolution thinks it appropriate, which is actually right now on both the monthly and the daily. The weekly is mixed but bearish.
Friday, September 30, 2016
The Timing Array, Unlocked
The Timing Array
I think I figured out what happened.
The top line is "turning points" which are highs or lows. The high or low bars are not always highs or lows in price. They are just turning points. They can be opposites.
The big blue bar on the 29th was the turning point from the 3 day uptrend. It hit the intraday high (albeit barely).
It then went on to hit a low, and conclude the next cycle within one day. Today is also a turning point. It's a turning point HIGH after the previous low yesterday.
Tomorrow is a turning point and a panic, so it might be two turning points again.
On Oct 3, the par is reversed from the previous. On Sept 29 the bar was the same color. I will tell you what I think this means
On sept 29 it was the turning point from the trend leading up until that day, so it broke the previous day's high before it broke the previous day's low.
On Oct 3, it will be a turning point in the opposite direction of today because tomorrow's bar is a different color than today's, meaning it will break today's low before it breaks today's high. This seems more possible when you notice the overnight (weekend) volatility, very high! So I'm thinking this is downward volatility.
On October 4th there is a continuation of the cycle, which I suppose means it will go up? And then there is another turning point that day. It will take out the previous high.
This could be backwards, so don't go crazy.
So I suppose a "Panic Cycle" Means there are 2 turning points in one day, and on the 6th, there should be 3!
More Timing array thoughts

It appears today's blip is actually an UP cycle, and the up cycle of the last 3 days did some funky reset. This means that tomorrow is a down day, but also with a panic cycle.
Now we are almost at yesterday's high!
I'm going to update this post later so check back before the close.
9-30-16 DJIA rule of 3 attempts test
UPDATE: Yeah, I knew this was some bullcrap. Fortunately it got me to hold on to my puts longer and take heavier losses :P

I once heard martin Armstrong say that if a price is tested 3 times and fails, it will not be tested a 4th time. I'm not sure how strictly to apply that rule. Does it have to be the exact price each time? Can it be a sloped line?
At any rate, this is a perfect horizontal alignment.
9-30-16

I think today is going to be a down day, with the initial spike up being some of that "overnight volatility" from the timing array.
UPDATE! It's headed back up at the moment, but I'm mostly confident it will be a down day. Stay frosty! I'm going to wait around for more direction.
Thursday, September 29, 2016
Idea for fundamentals
Do a diary!
Just so you can clear your thoughts about what your plans are. Probably include a general picture about when to get out of the position. (either a time or until it hits a certain price, or until a chart starts looking a certain way)
I've made some plans, and then forgot that I was going to do it a different way, and then regretted it.
When the market is moving fast and furious, you don't have enough time to process everything.
I think I've pieced the timing array together

Today was the conclusion of the 3 day uptrend (very early in the day) and tomorrow should be a continuation of the DOWN trend.
But since I'm not positive, I will just ride out the overnight and wait for the signal tomorrow, either a buy or sell.
I just thought it was important to mention it might be a sell, since I previously mentioned I thought it was a buy.
The main thing is to be ready for panic cycle days. If I'd have known what today's panic cycle bar meant, I'd have made so so much money.
Briefly, the direction should continue until shortly after it takes out the previous high or low, and then watch for a change, and ride that at least until the other end is taken out.
Yesterday the dow had a high of 18349.86 and today was 18366.23. On the low end:
The dow hit 18,179.34 and today saw 18,091.64.
If you just took the minimum move from high to low, you'd have caught about 170 points, which is a lot. If you bought options expiring the day of, or the next day, you'd be too rich to read blogs already. That's pretty reckless though, and I'm not saying you should do that. That's just the upper limit on what you could possibly make. In real life you have to balance risk.
What does a double panic cycle mean???
Pay attention to the panic cycle line, and then look at October 6th.
A panic cycle, as you now know, means taking out the previous highs and lows.
What in the world could the double sized bar mean? Does it mean it takes out the highs and lows twice?
Now that I'm thinking about it, I think there will be an "outside reversal" meaning it will high a target in one direction, bounce off, then hit another in the opposite direction, and end up somewhere in the middle.
I wonder if I can incorporate a chat box into a post like I've seen on some places. So we can follow this real time. Probably yes, but will I take the time to figure it out???
Timing Array Definitions
I did some brief research and got some more definitions you might find useful
The volatility line is like the top point, these are "turning points" so the turning points on the array can be either highs or lows, like the highest bar might be the lowest volatility. Or the highest.
Panic Cycle - I'm going to include it here even though I just said it. It means the price of the day is likely to move past the previous high and low.
Directional Change - It's not a high or a low (necessarily) but it marks an increase in conviction, which can be in the same direction, or the opposite.
Top line - the sum of all other lines (plus like 70 others) This marks turning points. A high on this line could be a high in price, or a low.
Volatility - this actually means volatility, unlike the "VIX" which just means bearishness in stocks. Volatility is supposed to be wild swings, probably what it means is a large distance between the high and low of the day.
9-29-16 Gold quarterly array
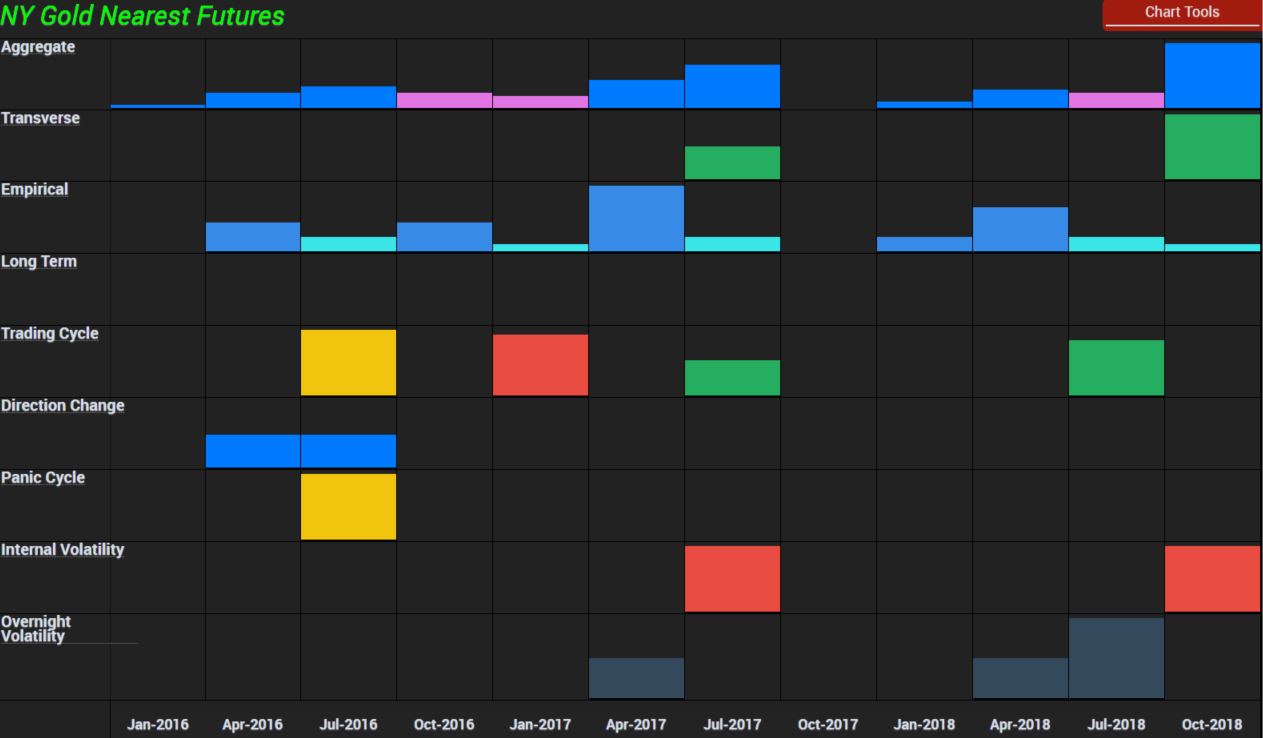
Gold has been up all year. It looks like in this 3rd quarter, we got a quarter exactly like today on the Dow. Panic cycle, directional change. To me this says we have turned down on the quarterly scale, which will turn around somewhere in the 1st quarter 2017. I'm going to go out on a limb and say there are some PM lovers here, but don't hate the data. That is an emotional reaction.
Then look for 2nd and 3rd quarter to be bullish quarters. Who knows wtf is happening in 3rd quarter 2017.
ADD ON: So there should be major highs somewhere Jul-Sept of next year, and another somewhere in the last 3 months of 2018. That one might not be the high, as we don't have the next bar after. also, despite the april 2018 bar being smaller than the July bar, I think it translates to a higher price, it's just a smaller rally, but starting from a much higher place.
9-26-16 OMG, WE GOT ONE! DOW TIMING ARRAY
I'm not going to say how much I made off of the last one (in dollars), but I pretty much tripled my money over that 2 week period.

Again, we are paying attention to the TOP line only! Oh, and maybe to panic cycles too. The biggest volatility day on the last chart didn't mean anything. Panic cycle just might mean it's a bigger than usual move.
First a definition: Panic Cycle - Likely to exceed the high AND low from the previous day. So if you were day trading, chaching is all I can say about that. And we got a lot in the next 2 weeks.
Remember, up on this, doesn't mean up in the markets, it means building to a turning point, which is the highest bars.
Some more facts given by he who knoweth what the heck this says
close tomorrow below 18247.79 means move lower into early October
Close below 18138 means close the year below 17823
* These prices often mark possible bounces. Right now we are at like 18170.
Overall I don't know how to read this, but I think I might get a beat on it at some point tomorrow.
I'm thinking up tomorrow, open up the next day and close lower (panic)
bottom again on the 4th before we hit 2 panic and a extra big panic
down again on the 7th and 10th (panic), each with a directional change
up 11, down 12.
But overall, my bottom line here is to get out today and then get ready tomorrow.
The next few days
Tomorrow the 30th is the last day of this rock solid timing array we had. There is a new one BUT, it's QUARTERLY :P. While that won't be great for our type of trading, it does help give us something to use as a bias. Meaning if we know stocks are going to do a certain thing for a 3 month period, we can be more aggressive when evolution lines up with that. I'll get to these arrays later. It's not urgent, as the first entry starts on October 1st.
So tomorrow is actually an up day, which makes sense given how rapidly this has flopped around. I'm going to be divested overnight, and if it goes BUY on the 30 and 5 minute charts together, I'll buy and close later in the day.
Many of these days have started out in the opposite direction. I got psyched out this morning and it cost me a potential fortune!!! I'm still up on the day so don't feel bad for me.
This is pure crazy, but sometimes I buy options that expire in mere days, Greg recommends 3-6 months.
Wednesday, September 28, 2016
I just realized
A) I went almost all day without posting! omgz
B) I haven't been doing much evolution lately! gasp.
discuess
A) I've just been focused on the overall market because I've had some info from Polny and Armstrong that proved reliable, so I didn't mess around picking stocks.
B) I plan on getting back to more traditional stocks after tomorrow, and especially after the 10th.
Sometimes I find stock picks are a lot of work and I am better off just paying extra attention to one thing and buying more of it.
Tuesday, September 27, 2016
I got authorized for extended hours trading!
Now I can beat the rush in the morning. I was originally expecting a higher open on Wednesday, but I couldn't be long overnight, because of this rule:
For things held overnight and closed the next day, you don't get the buying power back until the following day! I definitely want to go short before Thursday, which means I can only be long on wednesday if I open the long position on wednesday.
Although now I've lost confidence in a strong open tomorrow, due to the strong day today and weak ending to the day. Hopefully I can spot a low during the day to go long until close, when I will flip to short for a projected shit storm on Thursday.
To get authorized you just call in.
And Friday is the last day on the timing array that we have :(. It appeared to be a weak gaining day, but it's so far out that it could easily have changed since then. Up until now though, every day was accurate.
A general chart about bubbles
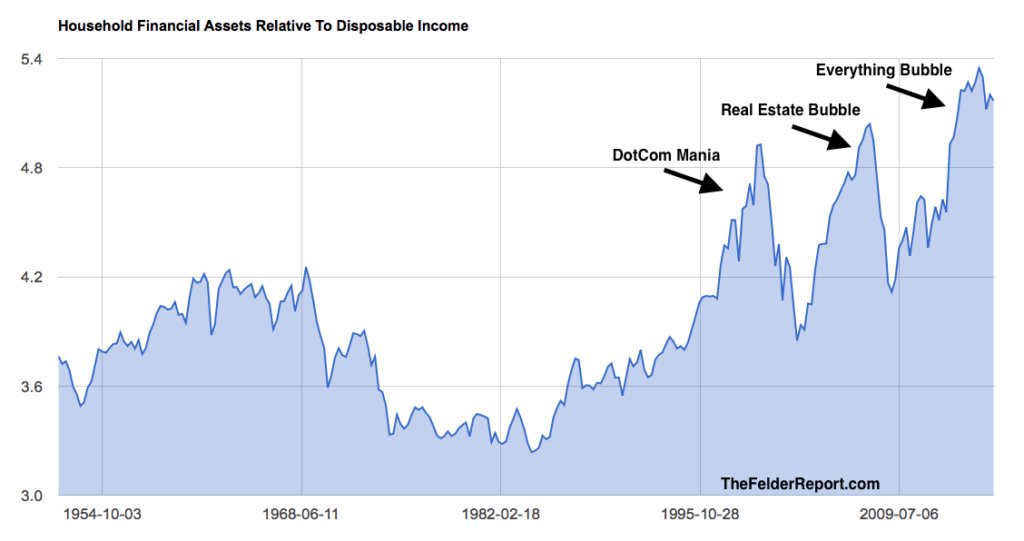
This is basically people's net worth (on paper, i.e. phony wealth that will evaporate), vs how much money they make.
A phony wealth to real wealth ratio, if you will.
I don't get too caught up in these "worst since Lehman" charts, because everything is always worst since Leyman, so don't try to use this as timing for anything.
Monday, September 26, 2016
Why I like trading SPX
The SPX is around 2,000 dollars, so commissions per dollar you want to invest, are very small. I think it costs something like 75 cents per each option plus the regular commission.
To get the same amount of money invested into SPY or DIA, you'd have to pay 20 times more in the extra commissions! Sometimes I end up day trading a couple times. If I break even on a trade it's nice to only have blown 30-40 in commissions instead of over $100.
There is a bit of a spread on the bid/ask, but it's very easy to meet in the middle, and if you end up paying more than the middle price, this difference is very tiny when distributed across the entire option value.
Stocks for the next few days
I was quite right about today! I ripped the face off this market.
Based on the timing array, tomorrow will be a rebound, but probably quite small, with Wednesday being big gains, and Thursday being a major losing day. Additionally, Bo Polny aligns up with this perfectly. He recently called the tops in mid August, Sept 6, and Sept 22.
Realize this: If you go long on Tuesday and close that on Wednesday, you won't be able to reuse that money until Thursday morning, where most of the gains might already be over. For example, today, the market is up from the lows.
I think the down day Thursday will be much greater than the up day Wednesday.
I think I'll personally go in a little on Tuesday, on the long end, but save most of it for Wednesday morning so I can go long and get short at the close on the same day.
9-26-16 Looking back into XLE
With XLE not being destroyed today, it's looking like it's about to go to a buy! Last week ended up looking like a good candidate for a bottom.
I consider my call to wait, highly prudent.
So I'll probably buy this through the 28th at some point (not yet) but probably not beyond, because of the Armstrong daily timing array looking really bad for stocks on the 29th.
I consider my call to wait, highly prudent.
So I'll probably buy this through the 28th at some point (not yet) but probably not beyond, because of the Armstrong daily timing array looking really bad for stocks on the 29th.
Sunday, September 25, 2016
9-25-16, Looking into XLE

I would surely avoid this for the time being. I say that with the expectation of a down down for stocks in general on monday, and I don't think this will be an exception.
It also nailed a sell signal on the monthly chart, so this one could go really bad. It might do better Wed-Thurs.
Mannarino's Video:
Friday, September 23, 2016
Where I Think the Market is Going Monday
It's Friday afternoon. Do you know where your charts are?
This is my best interpretation of the data.
 We've been at a buy signal off and on since that last pivot point. The strong buy yesterday lost some steam today, but it's still mostly bullish. In this case the timing array won out, as did Bo Polny :P There is some day left though, and if this closes below the cyan line, then it's looking pretty bad. That might be enough to turn the green and orange lines down too.
This is why it's important to look beyond the daily. I recently did a post saying that it would go up for part of this week and turn down late in the week.

It's pretty aggressively bearish on this sell chart. The green arrow just means that it's a low for the period and we can easily take that out.
So, in my humble opinion, this day to day stuff is giving way to the longer term weekly bearish trend, established by about 9-7! With an all time high in the Nasdaq. The post fed bull market jibberish was allowable movement in this weekly bear trend, much like Brexit was an allowable drop in the bull trend.
Based on the timing array, Monday looks like a big drop, much bigger than today.
This is my best interpretation of the data.

This is why it's important to look beyond the daily. I recently did a post saying that it would go up for part of this week and turn down late in the week.

It's pretty aggressively bearish on this sell chart. The green arrow just means that it's a low for the period and we can easily take that out.
So, in my humble opinion, this day to day stuff is giving way to the longer term weekly bearish trend, established by about 9-7! With an all time high in the Nasdaq. The post fed bull market jibberish was allowable movement in this weekly bear trend, much like Brexit was an allowable drop in the bull trend.
Based on the timing array, Monday looks like a big drop, much bigger than today.
Revisiting the timing array
 This is supposed to be a 2-day slide I think. If it looks like the previous 2 pink days. Then the blue day on 9-27 should essentially be flat, followed by a very big day.
 Monday's drop looks more severe than todays, based on this array. I don't understand the volatility row. It goes from really high today to non existent on Monday.
At this point it looks like be short until the 26th. Probably wait until the 27th and go long then. Sell on the 28th. I think the large difference in height between the 28th and 29th indicates a pretty aggressive drop that day, also, note the panic cycle bar. That looks serious.
This is so choppy I wonder if evolution will have trouble with it. I've found evolution to work the best in stable environments, and Armstrong says his stuff works best in the craziest of environments.
This is the timing array talking not me. Since we are getting a ways out from when this graph was made, it might have changed. I hope we get a new one soon.
Probably not the worst 1 day drop ever (updated)
UPDATE! It has bounced up a bit, and then came back down to the low line. This bounce was much less than the previous bounce. I think that means it's still downtrending.
It could get interesting though if that low (red line) is taken out
Keep in mind the bigger drop is supposed to be tomorrow according to the timing array.
It could get interesting though if that low (red line) is taken out

Keep in mind the bigger drop is supposed to be tomorrow according to the timing array.

More on 9-23-16

Thursday, September 22, 2016
Dow Timing Array, I should have posted this before the close!
Actually I have posted it before, I'm not sure it worked though.
 This is property of Martin Armstrong, but he once said he didn't mind plagiarism. The key line (and the only one I mostly understand) is the top one. It's not necessarily up/down in the dow, but a turning point. I think it could go from up to flat, then when it switches again, it could be either up or down.
This perfectly nailed the 9-15 top, 9-19 bottom, and the 3 day rally after that. It peaked again today, indicated a turning point, which I expect to be down. This is in contrast to evolution on the daily chart, however the sub-daily chart is a sell and the weekly chart is arguably bearish. I am a strong advocate of using evolution beyond the daily chart.
This perfectly nailed the 9-15 top, 9-19 bottom, and the 3 day rally after that. It peaked again today, indicated a turning point, which I expect to be down. This is in contrast to evolution on the daily chart, however the sub-daily chart is a sell and the weekly chart is arguably bearish. I am a strong advocate of using evolution beyond the daily chart.
ARG! Fidelity not working!
So I can't look at evolution at the moment. I checked trading view! It's not working either.
 Now I am stuck with this. But wow on that trend line! It's perfect.
This is the 1 minute chart, and its a very small range. Mostly I'm paying attention to the top.

This is the 1 minute chart, and its a very small range. Mostly I'm paying attention to the top.
Which line will win
The high for the day (pinkish/purple/fushia) or the bullish EMA line?
 The choice is yours.
Hint: This battle is already over on the hourly, and the EMA line lost

Hint: This battle is already over on the hourly, and the EMA line lost
9-22 VIX options anomaly?
I don't quite understand. Observe these options
 The calls on VIX for 12.00, should be roughly equal to the puts on 12.50. Actually it should be maybe 10 cents cheaper because the price is closer to 12 than 12.50.
In fact, is so extreme, look at the one I expanded, at 13.50 for Oct 5.
IF you bought those puts, and the vix didn't move, you'd make a lot of money. Pay .7, so as long as the price stays below (13.50-.7 = 12.80) then you will make 64 cents per option profit. You'd honestly double your money. The only way this wouldn't pay off, is if stocks crashed and the VIX shot up......?????
If I look at VXX instead of VIX, I don't see this.
9-22-16 Nothing Will Be Spared Tomorrow
This are all 30 minute charts. They are all turning south. This could be the start of the big one. Maybe it will rebound to a second top on the day?
These charts don't prove the crash tomorrow, but they do prove that EVERYTHING is trading together right now!


disclosure time! I know very little, and this is all my opinion!
If you perceive me as attacking you for fun, I can assure you it's my honest opinion and I don't hate minors. I do however, dislike the strategy of trying to find excuses to buy something specific, like mining stocks. It's emotional trading and I used to do it!
These charts don't prove the crash tomorrow, but they do prove that EVERYTHING is trading together right now!


GDX and SLV maybe? rising above. I'd watch. There's a solid sell signal here.
There is one possible exception that might go up tomorrow

If you perceive me as attacking you for fun, I can assure you it's my honest opinion and I don't hate minors. I do however, dislike the strategy of trying to find excuses to buy something specific, like mining stocks. It's emotional trading and I used to do it!
Wednesday, September 21, 2016
9-21-16 SPX intraday
UPDATE! Now we are at the top of that wedge I was talking about. Is it time to short? I'll watch for a short signal (not the big short, I think we will still get a new high tomorrow)
This seems to have bottomed for the day, at zero gain. Just like yesterday before it took off (and ultimately finished back on the bottom. I'm confident in Armstrong's model that stocks will not break the low from the 19th, and evolution backs it up, as does my expectation that the final top will be the 22nd.

9-21-16 OIL
This is a little bit bearish temporarily on shorter frequencies.
It's a bit bearish on the UO today so maybe you want to wait a day. Sadly I've been in this one since I missed that signal to get out from the last buy :/ I failed to babysit my position.

9-21-16 SPX - I spotted a chart pattern
This image is from Wikipedia.

See if you can spot one in the chart below! It requires a decreasing volume as the range contracts, which is the case (volume not shown).

Let me guess, we break this on the 22nd before the crash the next day? If I see this break, I'm hopefully short already.
Of course, Evolution is a better signal than this, so I won't do anything without Evolution being on board.
To that one person who is big into miners
In my humble opinion, it stinks!
I've done my best to find all the evidence I can, and it all points to a market crash on the 23rd. This one could be severe. It would take like, a bunch of charts to say everything, so I'm just going to describe what I see on evolution.
Before I do that, I must ask, how many times have you been long metals related stuff and got burned?
The Pros
1)Right now SLV has one of the best buy signals I've seen since doing evolution. Not just on the daily, but on the weekly, hourly, 30 minute chart,(until you go out to the monthly)
2) GLD might be even stronger!
3)GDX is a buy, on the daily chart, but it is not as powerful looking as the metals themselves.
But, and this is a big but, there are some cons here.
1) The COT reports - banks are BIG into shorts, near record levels. The only time they were more short was just recently, and they have covered ever so slightly as the metals are off the highs. These people have historically been right every time, however, this doesn't mean anything is imminent.
2) GDX was a near sell on the weekly, based on last weeks close. There is a bullish pivot point warning, as the only blemish to an otherwise perfect sell signal. On the monthly chart, it is a straight up sell signal (if it closes somewhat close to the current price)
3) These things are prone to violent smashes
4) In 2008, initially metals and stocks crashed togehter. If this lasts 3-4 months, you could lose your shirt.
5) Martin Armstrong is bearish until 2017 when he believes it will finally lift off.
6) Ok, I will post one chart. First, see if you can find the giant sized warning here:
 Guess how many times the price has crossed this 50 month moving average? If you said once in ten years, you are correct. I think this is a fabulous point for a bounce, and look at that, an arguable sell signal at the same time.
If this crashes down to the 50 week moving average from the 50 month moving average, then this will be a 3 dollar drop. I made a few thousand dollars today banking on the S&P to bounce off of the moving average on the 30 minute chart, so this one will carry considerably more bouncing power. The gold chart similarly bounced off the same moving average, but did get barely over it before starting the bounce.
In my opinion these are about to crash, probably on the 23rd, but probably go up until the 22nd.
Let me ask you this, why be long metals when you can be short stocks with a much higher probability for success?
If I had to bet for the 23rd, for gdx to go up, go down, or go down more than stocks, I'd probably pick the third option. I believe evolution will get this right, so lets' agree to check back on this tomorrow before the close, and then constantly on Thursday.
I found another chart that might be helpful:
 Looking at the same MA, the last time this crossed, it reversed the same amount, and then reclaimed it's downward trend. Recently, this crossed again, and got back down to the line. If it overshoots by the same amount that it overshot, it will drop another 30%. I think that will be a good buying opportunity.
Also note the horrific sell signal. I could see the daily getting us back to that EMA line, before the monthly trend takes over and sends it down to <20.
I don't know all the specifics, those are just guesses, but ultimately I see a much better bet available. I'm not trying to argue with you, I'm just going to a bunch of work to hopefully give you more information to make the right choice, and I'm doing it at 1:46 AM and I have to work tomorrow!
I've done my best to find all the evidence I can, and it all points to a market crash on the 23rd. This one could be severe. It would take like, a bunch of charts to say everything, so I'm just going to describe what I see on evolution.
Before I do that, I must ask, how many times have you been long metals related stuff and got burned?
The Pros
1)Right now SLV has one of the best buy signals I've seen since doing evolution. Not just on the daily, but on the weekly, hourly, 30 minute chart,(until you go out to the monthly)
2) GLD might be even stronger!
3)GDX is a buy, on the daily chart, but it is not as powerful looking as the metals themselves.
But, and this is a big but, there are some cons here.
1) The COT reports - banks are BIG into shorts, near record levels. The only time they were more short was just recently, and they have covered ever so slightly as the metals are off the highs. These people have historically been right every time, however, this doesn't mean anything is imminent.
2) GDX was a near sell on the weekly, based on last weeks close. There is a bullish pivot point warning, as the only blemish to an otherwise perfect sell signal. On the monthly chart, it is a straight up sell signal (if it closes somewhat close to the current price)
3) These things are prone to violent smashes
4) In 2008, initially metals and stocks crashed togehter. If this lasts 3-4 months, you could lose your shirt.
5) Martin Armstrong is bearish until 2017 when he believes it will finally lift off.
6) Ok, I will post one chart. First, see if you can find the giant sized warning here:

If this crashes down to the 50 week moving average from the 50 month moving average, then this will be a 3 dollar drop. I made a few thousand dollars today banking on the S&P to bounce off of the moving average on the 30 minute chart, so this one will carry considerably more bouncing power. The gold chart similarly bounced off the same moving average, but did get barely over it before starting the bounce.
In my opinion these are about to crash, probably on the 23rd, but probably go up until the 22nd.
Let me ask you this, why be long metals when you can be short stocks with a much higher probability for success?
If I had to bet for the 23rd, for gdx to go up, go down, or go down more than stocks, I'd probably pick the third option. I believe evolution will get this right, so lets' agree to check back on this tomorrow before the close, and then constantly on Thursday.
I found another chart that might be helpful:

Also note the horrific sell signal. I could see the daily getting us back to that EMA line, before the monthly trend takes over and sends it down to <20.
I don't know all the specifics, those are just guesses, but ultimately I see a much better bet available. I'm not trying to argue with you, I'm just going to a bunch of work to hopefully give you more information to make the right choice, and I'm doing it at 1:46 AM and I have to work tomorrow!
Tuesday, September 20, 2016
A Question for People Using the Alternate System
I can't get this going. I'm at tradingview.com, and the only indicator options seem to be very basic.
Do I go to the interactive chart? Then what?
All I want this for is because tradeview does 24/7 bitcoin price and fidelity does not.
Do I go to the interactive chart? Then what?
All I want this for is because tradeview does 24/7 bitcoin price and fidelity does not.
Biggest week of your life T-3 days
Here it is Tuesday with the epic collapse happening on Friday. I expect the intraday high to be either the 22nd or 23.
Since it's a Friday, there is a risk of banks not opening up on Monday. Be aware of this if you trade options. I'm not sure what would happen to an option that expires during Holliday, and I don't want to find out.
If you know you are right, and the move is large, the best way to play it is go out of the money, short term. VXX is probably better for large moves than SPX. Of course, if you are wrong this will all cost you spectacularly. I'll also be looking heavily into banking stocks.
I'm thinking for me, playing before the fed meeting has about a 50/50 chance to go my way. Even if you call the non-rate hike correctly, do you REALLY know which way stocks will break in the short term? What if they say they will probably raise rates next time? I also think that waiting until after has a very high chance of going my way.
I'm going to be looking at evolution, but right now I'm thinking go short tomorrow after the fed. If there is another day of gains it will lose a bit, but if stocks drop 3-4% in one day, I don't want to miss that.
An intraday SPX chart


The 4 clues for Sept 23
UPDATE!: The 3 day trend from 9-20 to 9-22 might be a consolidation
First, with the hidden messages:
While searching for this, I also found him talking over a year ago about september 23 for 2015. I dont' think anything major happened. Possibly it was all for sept 23 of this year? HE mentioned the Simpsons season 24 episode 9 as having a clue for 9-23, in addition to bunch of "7s" which is a big number to those banker freaks.
Refer to my post on about the 7th. There was less info on that date, and it ended up being the reigning high on the NASDAQ so far. For some reason the NASDAQ has been the one being touted as following the biblical calendar of Bo Polny. More on that later.
Here is a quick shot of the nasdaq topping on that date, where the little black circle is.
 If this holds, there is very little remaining upside. Perhaps the 23rd is a double top?
If you desire a bit more meat in your evidence, from Bo Polny's stock market report:
August 24: First Price Drop? YES, a PERFECT BREAK of the BLACK LINE to the day! (GOLD arrow)
September 6: Price Push up (cycle high)? YES, a PERFECT cycle high to the day! (PINK arrow)
*****also see the afore linked to post! This coincided with the intraday top on the 7th****
September 21-22: Day before crash? TIME POINT TO SHORT the world stock markets!?
September 23: This Date is expected to be THE DAY a COLLAPSE begins!? He goes on to post a chart of the historical cycle, showing a crash on the 23rd.
Also, there is a fed announcement ending on the 21st. Expect hawkish tones!
Now gaze as this masterpiece of confusion!

Gaze at the top line. Purple doesn't always mean down days, and blue doesn't always mean up. According to Armstrong, with the high in on 9-15, this meant the two pink days would be down days. This line indicates turning points. It doesn't have to be a directional change in the market, but it often can be. The blue bar on 9-15 was a turning point, from up to down, which lasted 2 days, as predicted. I believe then, that 9-19 has a bottom, and it should go up for 3 days, topping on the 22nd? Followed by a down day with a LOT of volatility on the 23rd. This is not expected by armstrong to be a be-all end-all crash. It is possible I'm reading this wrong.
He also posted a weekly version, and the week beginning 10-10 is a major turning point also! A perfect fit with Bo. So I expect this to be a low (even though it is a blue bar)
And lets not forget about Evolution. Evolution is rather bearish on stocks long term, but not on the daily. This supports a perfect fit, with a rise over a number of days, and the next few weeks and possibly months being lower.
There is one more thing that is very important to mention. Hillary Clinton can't likely debate because of her health, however I am not a doctor! The debate is the 26th. Consider that whatever happens the 23rd could be a debate cancelling event.
First, with the hidden messages:
Refer to my post on about the 7th. There was less info on that date, and it ended up being the reigning high on the NASDAQ so far. For some reason the NASDAQ has been the one being touted as following the biblical calendar of Bo Polny. More on that later.
Here is a quick shot of the nasdaq topping on that date, where the little black circle is.

If you desire a bit more meat in your evidence, from Bo Polny's stock market report:
August 24: First Price Drop? YES, a PERFECT BREAK of the BLACK LINE to the day! (GOLD arrow)
September 6: Price Push up (cycle high)? YES, a PERFECT cycle high to the day! (PINK arrow)
*****also see the afore linked to post! This coincided with the intraday top on the 7th****
September 21-22: Day before crash? TIME POINT TO SHORT the world stock markets!?
September 23: This Date is expected to be THE DAY a COLLAPSE begins!? He goes on to post a chart of the historical cycle, showing a crash on the 23rd.
Also, there is a fed announcement ending on the 21st. Expect hawkish tones!
Now gaze as this masterpiece of confusion!

Gaze at the top line. Purple doesn't always mean down days, and blue doesn't always mean up. According to Armstrong, with the high in on 9-15, this meant the two pink days would be down days. This line indicates turning points. It doesn't have to be a directional change in the market, but it often can be. The blue bar on 9-15 was a turning point, from up to down, which lasted 2 days, as predicted. I believe then, that 9-19 has a bottom, and it should go up for 3 days, topping on the 22nd? Followed by a down day with a LOT of volatility on the 23rd. This is not expected by armstrong to be a be-all end-all crash. It is possible I'm reading this wrong.
He also posted a weekly version, and the week beginning 10-10 is a major turning point also! A perfect fit with Bo. So I expect this to be a low (even though it is a blue bar)
And lets not forget about Evolution. Evolution is rather bearish on stocks long term, but not on the daily. This supports a perfect fit, with a rise over a number of days, and the next few weeks and possibly months being lower.
There is one more thing that is very important to mention. Hillary Clinton can't likely debate because of her health, however I am not a doctor! The debate is the 26th. Consider that whatever happens the 23rd could be a debate cancelling event.
Monday, September 19, 2016
Martin Armstrong promised a 2 day skid
This was last Thursday, so today is the second day. Early in the morning he looked wrong, but it has since changed


He didn't say a 3 day skid, so this might bottom today if he is right.
Sunday, September 18, 2016
Potential big move on the DOW (and probably other stocks too)

While it is warning of a possible pivot point, I think that is automatically there as long as we are off the low. In my experience it really means nothing, and thus, this is a sell signal. It's extra significant because there is a fed meeting this week. I drew lines for hte previous sells. It's almost always followed by at least 1 week of declining price and often more. They aren't always meaty drops though. But look at this very long term monthly chart:

There have only been 3 sell signals!!! This one will require a closing below the blue line to be a sell signal. The previous sell signals have all been substantial, -50%, -10%, and -15%.
I drew in 2 gray lines that I think might have been sell signals at the time with the SD peak disappearing later. Also I circled the ONLY times that it has had 2 consecutive down months outside of a sell signal. And now I see one more that I missed.
So with a weekly sell signal, this month is very likely to finish as a sell signal, and it's going to be big.
It is momentarily strong on the daily, so this is lining up perfectly for a small bounce until around the fed time and then it goes to shit. Should be interesting.
I'm also going to mention Martin armstrong. He predicted a 2 day slide, and it looks to be over after one day. Perhaps we will find a low on Monday and recover, then he will sorta be right.
Other than banks, All stocks I checked seemed bullish. XLE looks a bearish (energy sector)
Saturday, September 17, 2016
The Big Picture after the week ending 9-17-16, with 7 sexy charts
I'll start with the big winner of the day. DB looked like a buy on the
previous week, and was doing find this week until today. It had gone
sell on the half-hourly the day before, but for the most part it was
bullish on the various charts. DB is likely going to be the first bank
to go so it deserves a spot here. It has also become a sell on the
daily after today's performance. 
Now, if I may, a gander at stocks in general:


On oil, note the weird frequency for this chart. I worked that out to be a half day. So this is not a conventional buy signal. I did this mini-zoom in from the daily to provide evidence that it might be turning around. It's been very bearish for a while now.

Finally I'll just leave off with a nice buy chart. During a down day this stock gained. It recently broke the dashed line, so it could be in line for a nice breakout. There is however, a giagantor head and shoulders pattern. Note the three recent red arrows. It had been a sell on the weekly, but today it finished about the weekly EMA.

Let me know if you find this interesting. It took a while to assemble it all, so I'm not going to keep doing it if it's not worth it.
Friday, September 16, 2016
9-16-16 O , The Big

Also of note, the UO is where it has traditionally turned around, or maybe even past that point.
Awesome performance of INTC

Mannarino bought this in the morning. His strategy is to go through all the major stocks each morning and look for new signals. If we'd been doing this we'd have not only caught today's epic gain, but almost all of yesterday's too.
So I'm advocating diligence for myself!
There was once an old computer game in which you got 50 points for diligence, just by going to every corner of a maze.
Thursday, September 15, 2016
What does these 3 VIX Charts say to you?
Chart first! This is a regular ole chart of the VIX, which is basically the inverse of stocks, magnified like 5 times. Form an opinion before reading on.

Now look at this chart with an hourly freq instead of daily.

Now, if you said ignore it and go with the daily freq, definitely check out this next shot of the weekly.

What I really want to draw your attention to is that apparently perfect bounce off the weekly EMA. Is that a turning point? If it hugs the EMA like it die on most of these charts, it will trend up, because the EMA is pretty steeply up right now.
In my experience, I look at these other freq(uencies) a lot and the evolution system is usually good on all of them. The indicators go by periods, so they adjust automatically.
The dips like the one that happened today are pretty common during a bullish day when I check hourly charts. Every so often it will dip below the EMA and shoot back up in the next period.
With the amount of daily choppiness that's been going on, maybe the daily signal is compramised? On the weekly, the most recent two lines look a lot like the two lines before them.
To me this looks massively bullish when you look at all the evidence available, but I really want to know what you people think. One thing is for sure, it could be a big move, and it will suck to be wrong!
I will pay close attention to that pivot point if it is a bullish day. It's been 2 complete days since the peak completed. How long does it take until it becomes permanent? I think if the price takes that out, they will take the arrow away.
Are you sure TSLA looks like a buy?

I recently did a post explaining that I think there will be a major market drop tomorrow, so I'm being extra careful.
Once again, I would short if I had to pick one, but I don't. That would be a short lived short though, so if you want to ride it out then it might work out in the long run. Maybe if the hourly turns positive in the middle of the day tomorrow.
The weekly is also bad.
You will Rue this day if you bought gold miners

A) There would be no rate hike
B) The reaction will be tomorrow.
A is probably true, but how do you know how people will react? Even if they don't raise rates they might say some gibberish, or there might be some data that that gets spun in some supposedly bullish way. My point is, you are trading guesses.
This is the weekly, it looks really bad. I'm apt to ignore that pivot point, because it occurred during immense volatility. If you smooth that just a little to adjust, there would be no pivot point. Every other indication is bearish. The daily is a mixed signal, and the hourly sucks balls. I already did a post in which it appears the weekly, if aligned with the hourly, is more powerful than the daily.
This is just 3rd world awful according to evolution. If you trade like this, you might score, but if you do it 10 times, you might lose 7 times.
If I had to play this for tomorrow (which I don't) I'd go short.
Subscribe to:
Posts (Atom)